
")
")
Orbit-Graph
SAMURAI™-Option
Orbit-Diagram
Vibration Analysis on Rotors

Overview
Application
The SAMURAI™ option Orbit-Graph is a simple initial method to recognize prominent vibration directions of machine parts and to evaluate them quantitatively. An orbit diagram shows the signals of two channels in an XY graph as a time-dependent curve.
In the case of vibration analyzes on rotors, the orbit diagram shows the movement or deflection of a rotating shaft. Typically, the signals from two eddy current sensors on the housing of a rotating part are used. The orbit diagram then can make problems such as misalignment and rubbing of the shaft visible.
Description
The option enables signals from two channels to be displayed in an XY graph as a time-dependent curve. The user selects the two channels for the orbit display and configures the display area and the sensor arrangement. You can also specify how long the data points remain visible to maintain readability. This prevents the orbit graph from being increasingly filled with data points when the vibration behavior.
The multi-channel data acquisition enables the simultaneous monitoring of bearings on rotating machines. Several orbit graphs can be displayed at the same time for the vibration diagnosis of shafts.
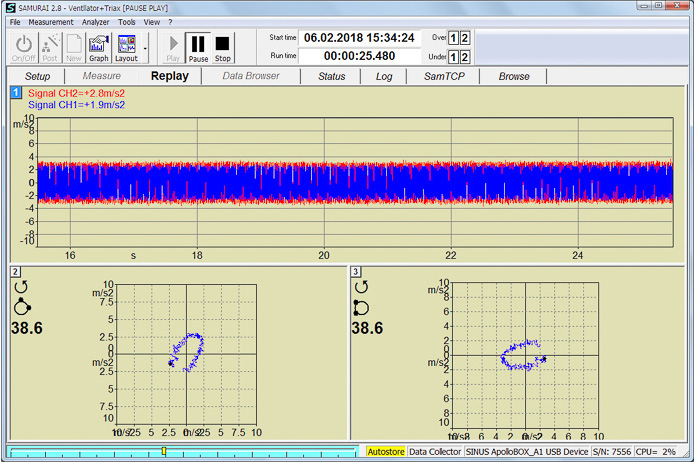
Figure 1:
Time signals and orbit display with different settings of the sensor arrangement
(Orbit-Darstellung der gleichen Zeitsignale bei gleicher Sensorposition während der Messung.)
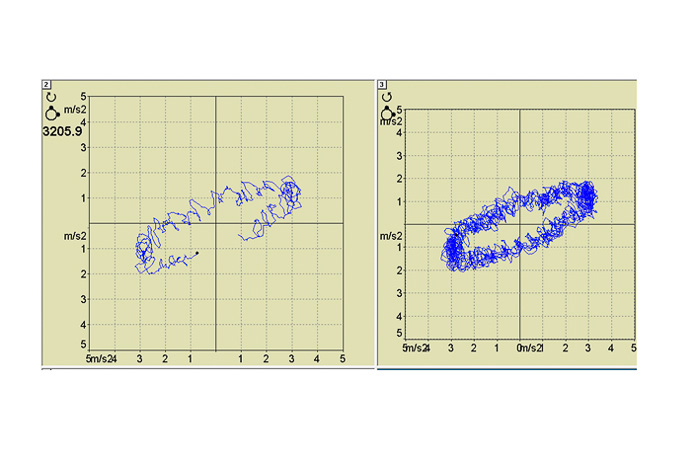
Figure 2:
Orbit display and plotted data points with different durations of visibility.
Features
| Scope |
|
Requirements
This software option requires a valid SAMURAI™ base license.