
")
")
SAMURAI
Software for Sound and Vibration Analysis
with Data Recorder and FFT Analyzer
SINUS Acoustic Multichannel Universal Realtime Analysis Instrument
Overview
SAMURAI - Universal software package for the real-time noise and vibration analysis
The SAMURAI software is our standard software for all SINUS analyzers. Comprehensive, standard-compliant SAMURAI options allow use of the software across all application fields of noise and vibration analysis. The software supports Windows OS and can be operated via touch screen. A clean and intuitive user interface offers a large variety of settings and configuration capabilities that eliminate additional customized programming even for complex measurements. Furthermore, the software allows remote operation via external programs using the SAMURAI Option: TCP/IP Interface and thus integration into larger systems or test facilities.
For recurring measurement tasks analysis parameters and channel assignments can be stored in set-ups. Additionally, the set-up of an already performed measurement may be reused or modified for a new measurement. Facilitation of recurring measurements is also achieved through the “Easy Operator Mode”. It allows use of individual set-ups where control and configuration options have been reduced to a minimum (i.e. only Start/Pause/Stop controls are available). This very easy operation enables users who do not know the system to perform measurements.

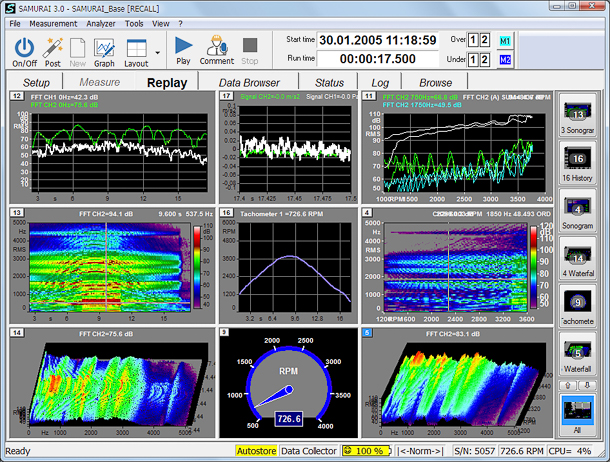
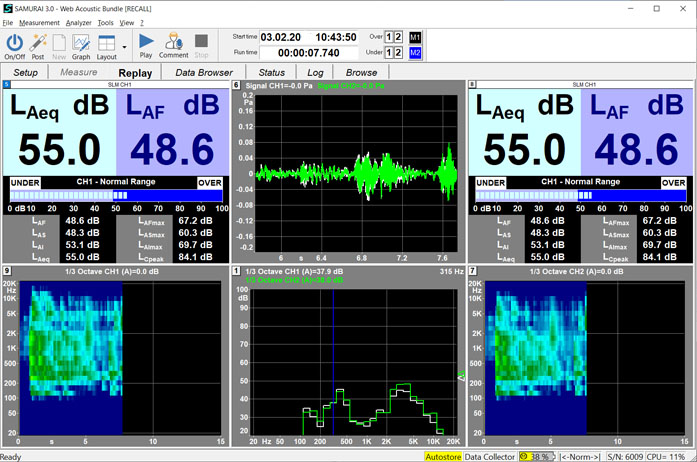
The “REPLAY Mode” of the software’s base version offers access to stored measurements for review, graphics’ adjustment and measurement data export. Stored measurements can be replayed on multiple computers without separate licences. With the zoom feature of the “Data Browser” parts of measurements may be highlighted, replayed and saved as new SAMURAI measurements. Furthermore, the SAMURAI Option: Post Processing offers later analysis of stored time signals.
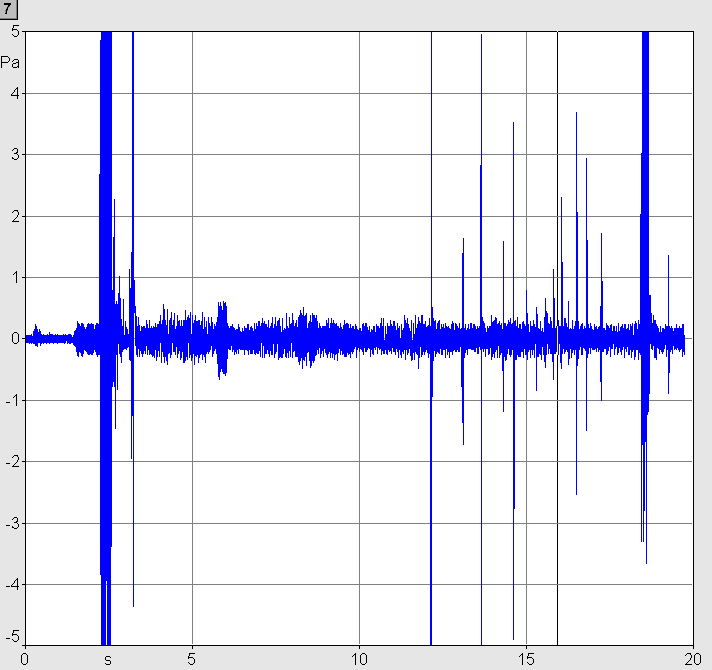
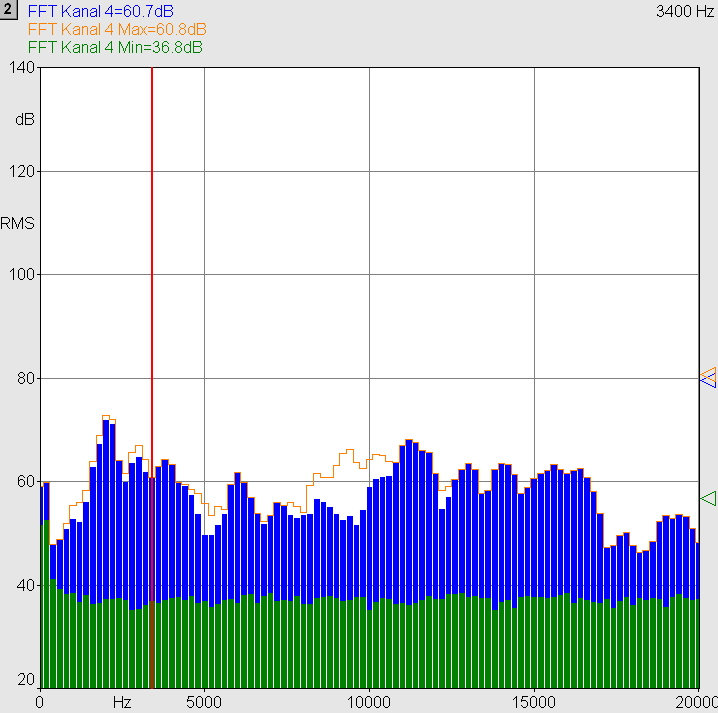
The figure on the left shows the Data Browser representation of the stored measurement values from a measurement with one channel. The figure contains the time signal, the sound level curve of one sound level meter value and the sum level of the FFT analyzer.
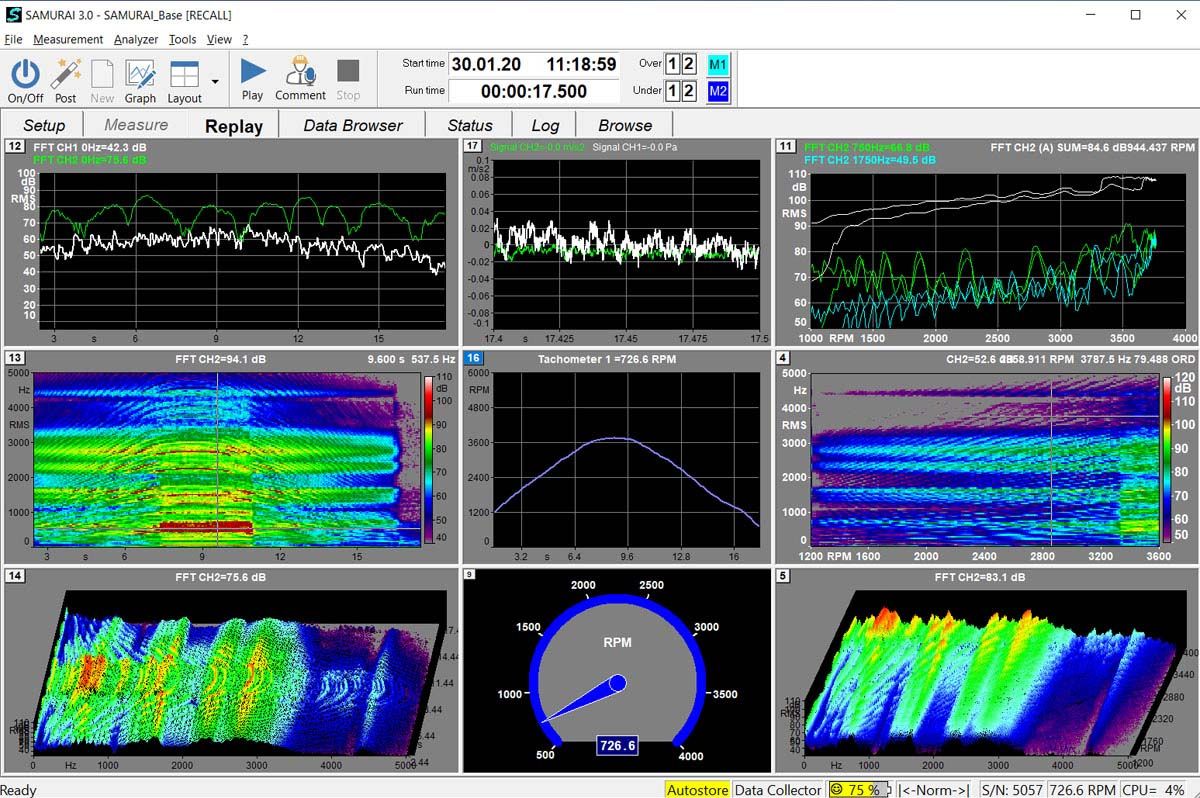
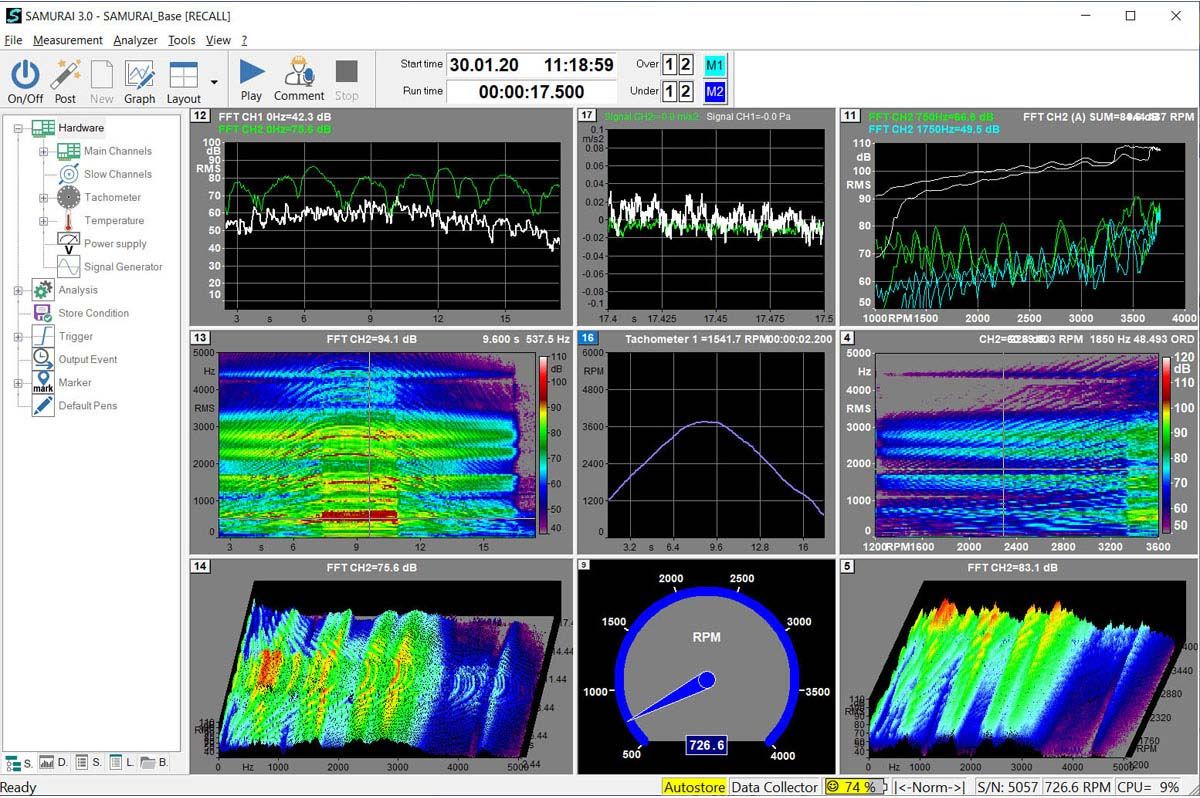
The high system performance of our DSP-based Apollo analyzers supports a large variety of simultaneous analysis functions for all measurement channels. SAMURAI offers excellent display options during measurement and post-processing. Basically the software contains multiple virtual instruments that supply measured data for the active measurement channels. There are different types of instruments that provide different data (e.g. level values, spectra, time signals, rotational speeds, transfer values, video signals, slow channels). These virtual instruments can be assigned to the active channels freely. Parallel to measurement and analysis the supplied data are stored.
Depending on the device type, additional output and auxiliary channels complement the main channels. The software supports control of the output channels to either replay the input signals during measurement or to output generated signals (e.g. noise). The analog auxiliary channels are used to capture slowly changing measurement values. The digital I/O may be used as external triggers, tacho or for GPS synchronization.
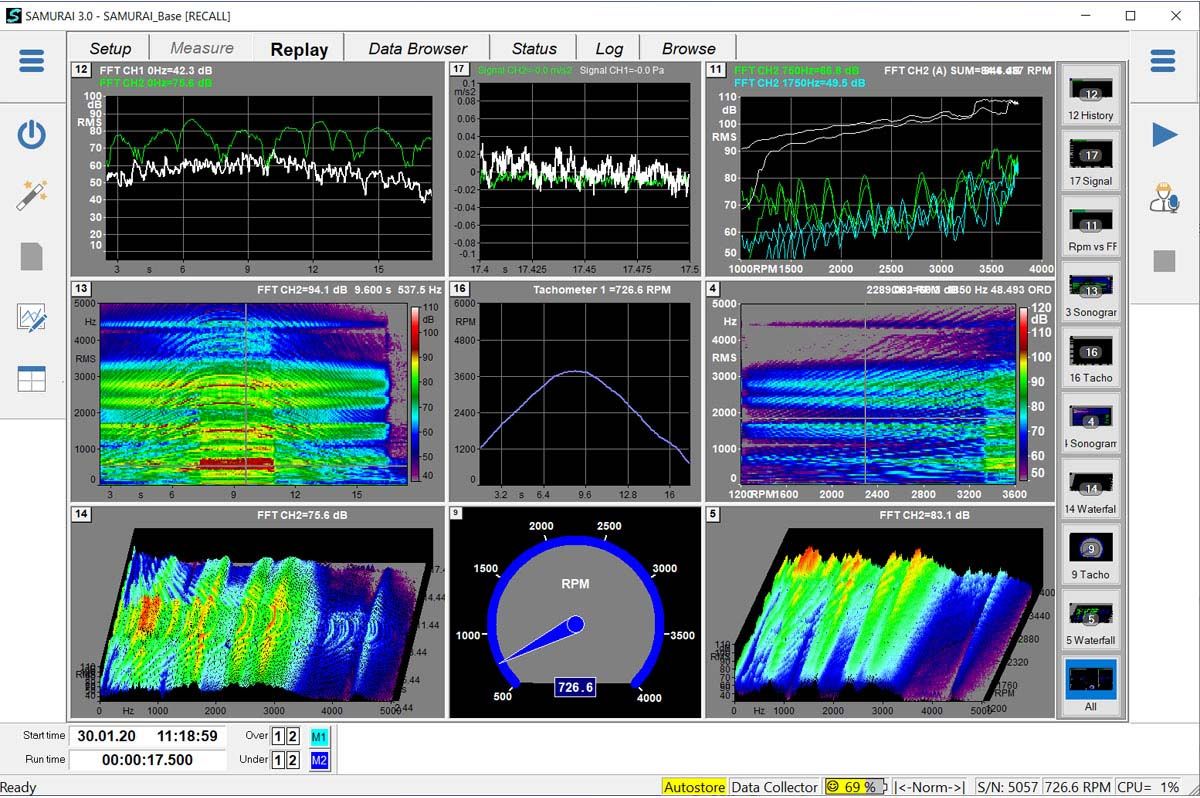
The measured values are displayed in up to 16 graph windows. Display may be configured before, during and after measurement. The measured values are stored in the background no matter which values are actually displayed in the graphs. To check the measured data during measurement the graphs may be selected individually using a side bar, which is shown in the left figure on the right.
The base version SAMURAI_base already contains the virtual instruments “Data Recorder” (time signal capturing), “FFT Analyzer” (fast Fourier transformation), as well as a variety of innovative functions:
Virtual instruments
Data Recorder
- Sample rates 200Hz to 204.8kHz, selectable per channel
- Signal bandwidths DC...80kHz, selectable per channel
- Triggered time signal storage available
- Ogg Vorbis compression
FFT Analyzer
- Bandwidth selectable in steps: 19Hz, 39Hz, ... 80kHz; number of lines: 101, 201, 401, ... 25601
- FFT window: Rect, Hanning, Hamming, Kaiser-Bessel, Blackman, Flat-Top, Bartlett, Welch, Gauss, Cosine N/4, Cosine N/8, Cosine N/16, Cosine N/32<
- <>Window overlap: 25, 50, 75, 87, 93, 97%
- Averaging modes: Linear, fast, slow, as well as exponential
- Simultaneous display of instantaneous, max, min, Leq and SEL spectra
- Display and storage of sum levels
- Bar, bar-contour and line graphs, band values as RMS, peak, peak-peak, EU² or PSD value in dB or physical units
- Up to 5 FFT analysers per channel
- Triggered storage supported
Other functions
- Integration of a sensor database for common sensor types (microphone, accelerometer, voltmeter, tachometer, thermometer, hygrometer as well as speed, travel, force, torque, torsion and pressure sensors)
- Multi-analysis with signal recording, FFT Analyzer, tachometer, auxiliary channel recording
- Graph types for measurement data representation, level history graphs, spectrum, sonogram, Campbell diagram, waterfall diagram, time signal, vsXref (level over speed), tachometer and other windows (see also options)
- Customization of windows by the user
- Measurement management with internal browser
- Data visualization with internal data browser
- Data storage on external USB drive possible
- Easy calibration check
- Comprehensive trigger and marker functions
- Display of multiple FFT spectra in the same window
- Display of octave and FFT spectra in the same window (in combination with SAMURAI Option: Octave)
- Value representation over time or speed selectable
- Integrated frequency generator for noise signal generation (white / pink) as well as sine sweep (in combination with SAMURAI Option: Reverberation Time)
- Use of the Windows sleep function to power the computer up or down at a predefined time
- Weight curve import and export
- Curve editor for reference spectra and weight curves
- Data export to the following formats: MS Excel, ASCII, WAV, Universal File Format (UFF), ASCII Raw Signal, HDF 5.0, MDF 3.0, Noise & Vibration Works (NWWin), Windows Media movie, Quicktime movie
- Sensor failure detection (detects broken wires of ICP sensors)
- Level monitor

To show a possible overload of the signal inputs already before measurement the level monitor is running always (even in STOP mode).
For the application fields acoustics and vibration we offer two cost-effective SAMURAI option bundles with a selection of standard analyses.
SAMURAI option bundles and other SAMURAI options
SAMURAI Acoustics Bundle
- SAMURAI Option: Sound level meter
- SAMURAI Option: 1/1 & 1/3 Octaves
- SAMURAI Option: Reverberation Time
SAMURAI Vibration Bundle
- SAMURAI Option: RMS-Meter
- SAMURAI Option: Transfer FRF
- SAMURAI Option: Order Tracking
- SAMURAI Option: Vibration Meter
Other SAMURAI options
View SAMURAI option overview ->
A large variety of SAMURAI options offers measurements in the field of sound and vibration analysis according to national and international standards as well as a large number of standard analysis methods.
New functions
New virtual instrument Intervals with percentile, statistics and interval graph
European directives require the characterization of environmental noise as Lden (day-evening-night level) or Ldn. Various regulations of European countries stipulate individual limits for day and night as well as week days and holidays to monitor the noise emission of construction sites and commercial facilities. Noise emission limits are often applied to strongly varying reference intervals from individual day-evening-night time intervals to much shorter intervals of 10 or 30 minutes. The required limits are based on different indications, i.e. not only on the Laeq, but often also on the LAmax or statistical measurement values as the percentiles L5, L10, L90, or L95. As a consequence, for the monitoring of environmental noise it is important to evaluate the noise level also in predefined intervals.
The statistical noise levels LN are used to monitor environmental sounds, for example to evaluate noise pollution in a town or by road traffic. In these cases the noise levels vary significantly over time. The statistical level values help to interpret the measured values.
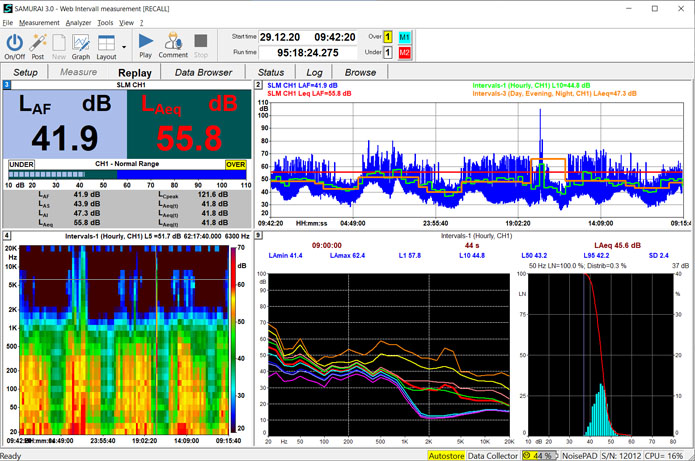
Example: The L90 describes the level that has been exceeded in 90% of the cases. That means for 90% of the measurement duration the noise level was higher than at least the L90 level. The L90 level may be used as approximation to the background noise level. The L01 describes the level that has only been exceeded for 1% of the measurement duration. That means for 1% of the measurement time the noise level was higher than at least the L01 level. The L01 may be used as approximation to the maximum level Lmax. The L95 level in 10-minute intervals can give a good representation of the traffic noise share.
The example on the left contains a history graph of the LAF values at 100 ms in blue, the 1-hour time intervals in green and the day-evening-night values in orange for the duration of 4 days. Another graph window shows the distribution and cumulative curve for each interval in relation to the 1/3 octave band that has been selected in the spectral analysis diagram.
Tonality assessment according to ISO 1996-2
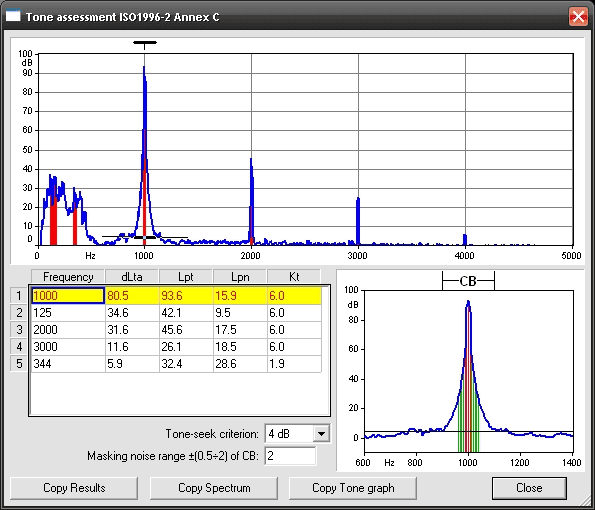
The SAMURAI Option Tone Assessment ISO 1996-2 allow assessment of the tonality according to ISO1996-2 Annex C.
The new Postprocessing Batch mode
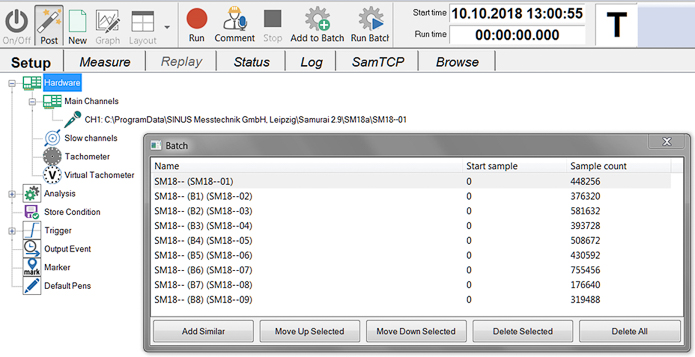
The button “Add similar measurements” allows to assign additional measurements as data sources during post-processing. With the button “Run batch” the calculation for all measurements is started sequentially.
New shape trigger
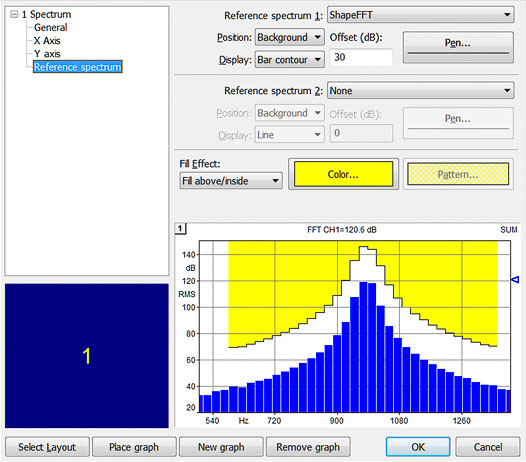
The trigger mode has also been upgraded. For example combined triggers can also be combined to create a new trigger.
The shape trigger is a new kind of reference spectrum trigger. Only the shape of the trigger is monitored to trip the trigger.
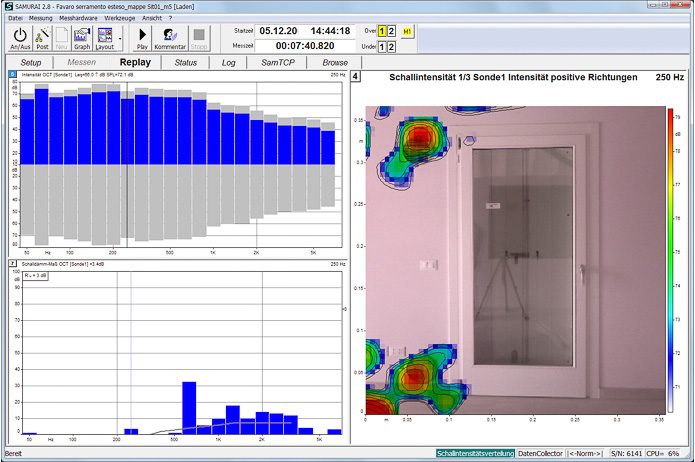
Effortless sound mapping
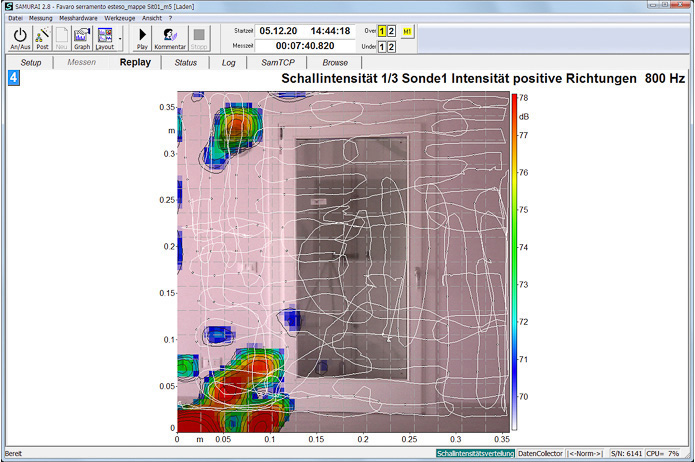
The new SAMURAI Option: Sound Map allows sound mapping of objects with only one measurement using a sound intensity probe or directional microphone.
During the intensity measurement on an imaginary surface, the position of the moving intensity probe is captured with a camera. After that the measured values are assigned to their place of origin via the video and the mapping of the analysis data.
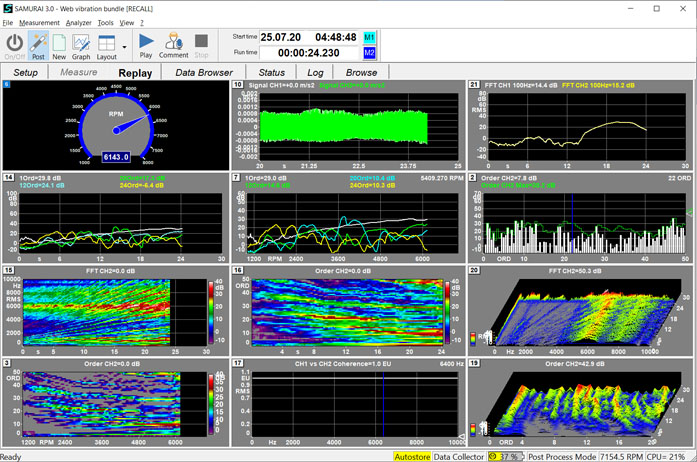
Digital order tracking
SAMURAI Option: Order Tracking
The SAMURAI Option: Order Tracking has been extended by the calculation algorithm of the digital order analysis and now offers the following new functions:
- Analyses with fast rotational speed changes
- High order resolution analyses
- No “blurring” of spectral lines
The figure on the left shows a comparison of the FFT method (Campbell diagram on the lower right) and the calculation using digital filters (Campbell diagram on the lower left).
New virtual instrument Synchronous FFT & Averaging
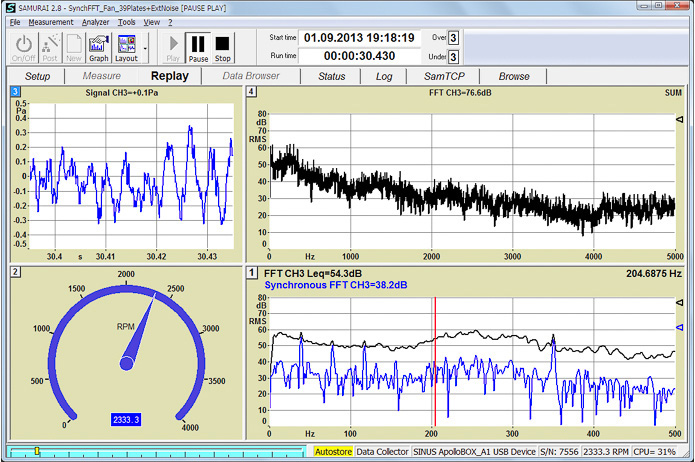
SAMURAI Option: Synchronous Averaging
Spectral measurement of periodical events in situations with high non-periodical interference level using SAMURAI.
Other new functions and enhancements of SAMURAI 3:
- Updated Data Collector
- Updated export menu
- Updated cursor mode
- New torsion-type sensor
- The job folder may now also be in a remote location and can be accessed via network, but only to load data.
- Additional stop trigger
- New fields in the orbit diagram for the label axis. If no tacho is available, the speed field switches to time in seconds.
- Copy measurement data from the CrossAnalysis graph
- New RMS meter trigger
- HVMA analysis without filter possible
- Updated Building Vibration option
- Updated Building Acoustics option
- Updated Sound Intensity ISO 9614 option ("Pause” mode...)
Furthermore, analyses can be performed with several virtual instruments of the same type (up to 5 sound level meters, 5 FFT analyzers, 5 octave analyzers per channel). This allows, for example, simultaneous calculation and display of multiple FFT analyses with different parameters per channel in one measurement.
Other new functions and enhancements of SAMURAI 2.8:
- Status graph
- SAMURAI Option: EASY LISTENING
- SAMURAI Option: LIVE SOUND POWER
- SAMURAI Option: SOUND MAP
- SAMURAI Option: ENVELOPE ANALYSER
- SAMURAI Option: SYNCHRONOUS AVERAGING
- SAMURAI Option: ZOOM FFT
- SAMURAI Option: ORBIT
- SAMURAI Option: RMS METER
- SAMURAI Option: VIRTUAL TACHO
- SAMURAI Option: RADAR speed sensor
- SAMURAI-Option: TONALITY ISO 1996-2 (Tone Assessment ISO1996-2 Annex C)
Developer
Interfaces for Software Developers
SAMURAI Option: TCP/IP Interface
The SAMURAI Option TCP/IP Interface allows external programs to configure and operate SAMURAI as well as to receive measurement data from SAMURAI via TCP/IP. Thus, SAMURAI is networkable.
System Requirements
At least Intel® Pentium® or AMD Athlon™ XP processor (Intel® Core™2 Duo processor or better recommended):
- 2 GB RAM
- Windows® 7, Windows® 8 or Windows® 10
- HARMONIE™, Apollo™, Soundbook™, Soundbook_Expander, ™SWING™, NoisePAD™, Hurricane™, Tornado, Typhoon