
")
")

Overview
Field of Application:
The aim of a spectral analysis is the investigation of a signal with regard to its components in various frequency bands, whereby the bands each have the same absolute (narrow-band analysis) or relative (octave-band analysis) width as appropriate depending upon the task to be performed. The octave-band analysis corresponds to the human tonal perception, e.g. the sequence of half-tone steps on a piano is comparable with the 1/12-octave-band analysis, which in turn is a refinement of the 1/3-octave-band analysis. A further reason for the use of an octave-band analysis rather than a narrow-band analysis is that the former tends to offer a better frequency resolution at lower frequencies.
Description:
This option allows the spectral investigation of the activated channels in 1/1, 1/3, 1/6, 1/12, 1/24 and 1/48 octaves, whereby the octave resolution can be selected on a per-channel basis. The central frequency of the highest frequency band corresponds to the audio/FFT bandwidth chosen in the setup. The lowest frequency band is 11 octaves below the highest. The octave spectra stored are calculated with averaging and/or time-weighting (FAST, SLOW, Exp.) from the sequence of "raw" octave spectra. The frequency resolution of octave spectra at low frequencies is inherently high. In order to achieve such high resolution with an FFT, a high number of lines would have to be chosen; however, this might then be at the cost of a lower time resolution.
The spectra can be displayed in spectral (bar/contour/line) graphs, sonograms and waterfall graphs. The time course of frequency bands can be shown in a time history graph.
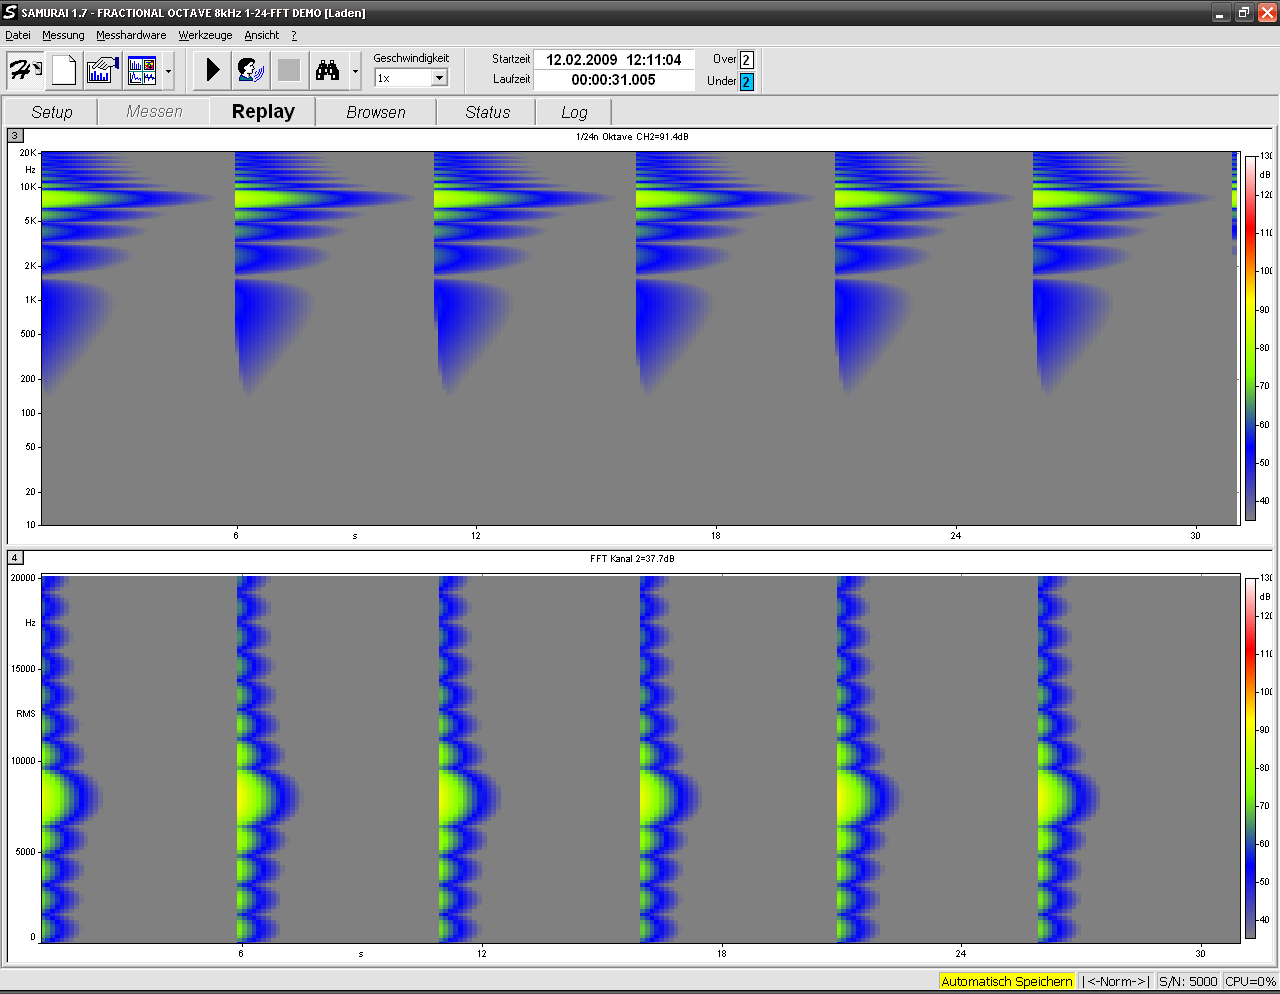
Figure 1:
Comparison between 1/24 octave and FFT of an 8 kHz signal
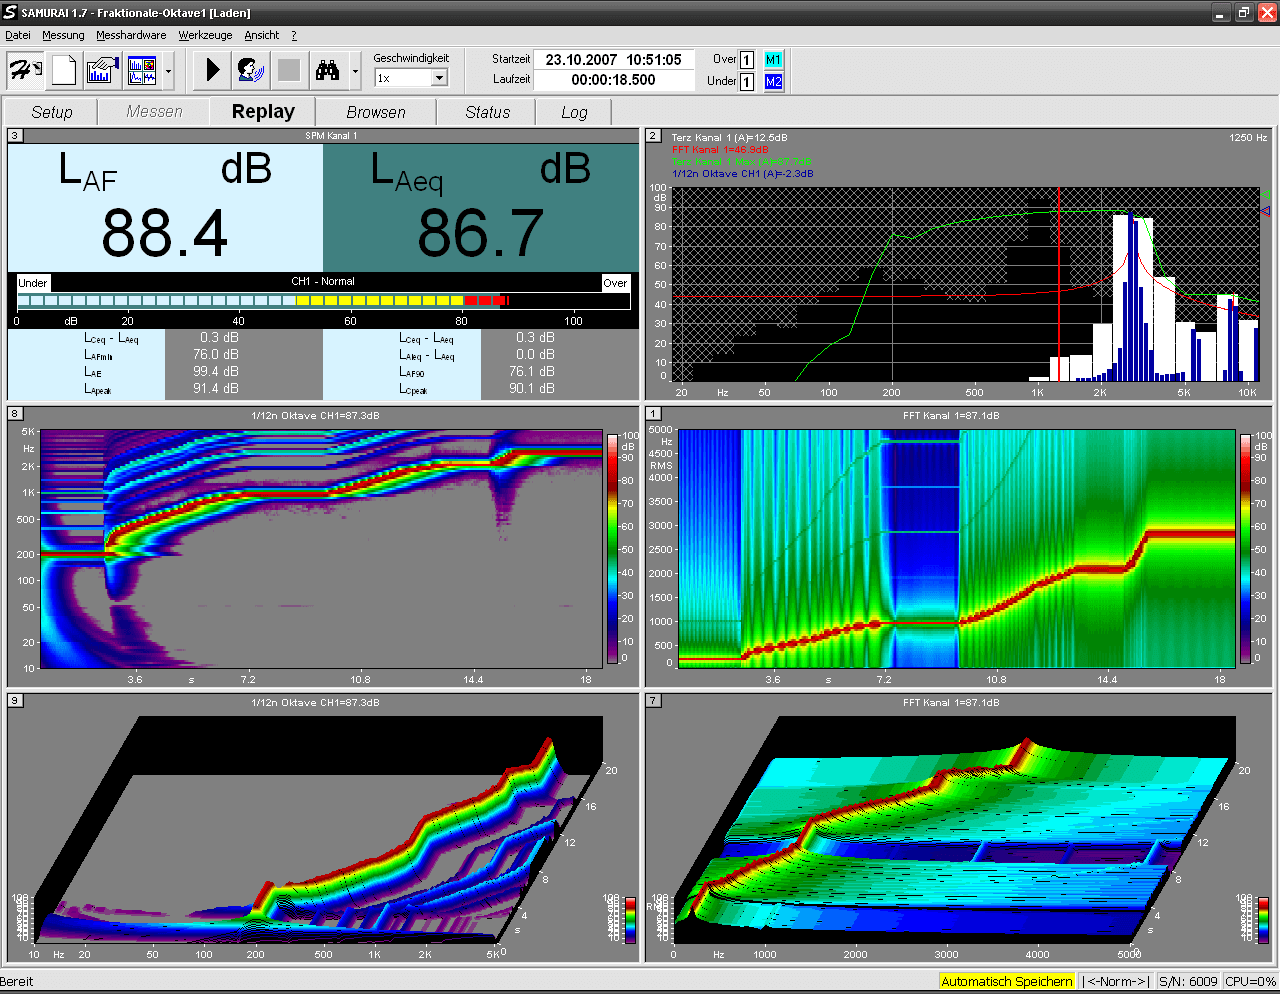
Figure 2:
Comparison between 1/12 octaves and FFT of a signal in the frequency range of 10 Hz ... 5 kHz (the frequency of interest starts at 200 Hz and ends at 2.5 kHz)
Standards
Implemented Standards
IEC 61260: Electroacoustics - Octave-band and fractional-octave-band filters - Part 3: Periodic tests; Octave class 0
IEC 1260: Octave class 0
Feature
| Measurement range | 0.01 Hz to 80 kHz, depending on audio/FFT bandwidth |
| Features |
|
Requirements
This software option require a valid SAMURAI license.